Aggregate the resulting clustering of the SOM algorithm into super-clusters.
superClass(sommap, method, members, k, h, clustering = NULL, ...)

# S3 method for class 'somSC'
print(x, ...)

# S3 method for class 'somSC'
summary(object, ...)

# S3 method for class 'somSC'
plot(
  x,
  what = c("obs", "prototypes", "add"),
  type = c("dendrogram", "grid", "hitmap", "lines", "meanline", "barplot", "boxplot",
    "mds", "color", "poly.dist", "pie", "graph", "dendro3d", "projgraph"),
  plot.var = TRUE,
  show.names = TRUE,
  names = 1:prod(x$som$parameters$the.grid$dim),
  ...
)

# S3 method for class 'somSC'
projectIGraph(object, init.graph, ...)

cutree(object, k = NULL, h = NULL)
Arguments
- sommap
A
somResobject.- method
Argument passed to the
hclustfunction.- members
Argument passed to the
hclustfunction.- k
Argument passed to the
cutreefunction (number of super-clusters to cut the dendrogram).- h
Argument passed to the
cutreefunction (height at which to cut the dendrogram).- clustering
Precomputed clustering provided by user. In this case, the function just returns a
somSCobject with this clustering but no associated dendrogram. Not all methods and plots apply to this case.- ...
Used for
plot.somSC: further arguments passed either to the functionplot(casetype = "dendro") or toplot.myGrid(casetype = "grid") or toplot.somRes(all other cases).- x
A
somSCobject.- object
A
somSCobject.- what
What to plot. Can be either the observations (
obs), the prototypes (prototypes), an additional variable (add), orNULLif not appropriate.
Automatically set for types "hitmap" (to"obs") and"grid", (to"prototypes"). Default to"obs"otherwise.
Ifwhat = "add", the functionplot.somResis also run with the argumentwhatset to"add".- type
The type of plot to draw. Default value is
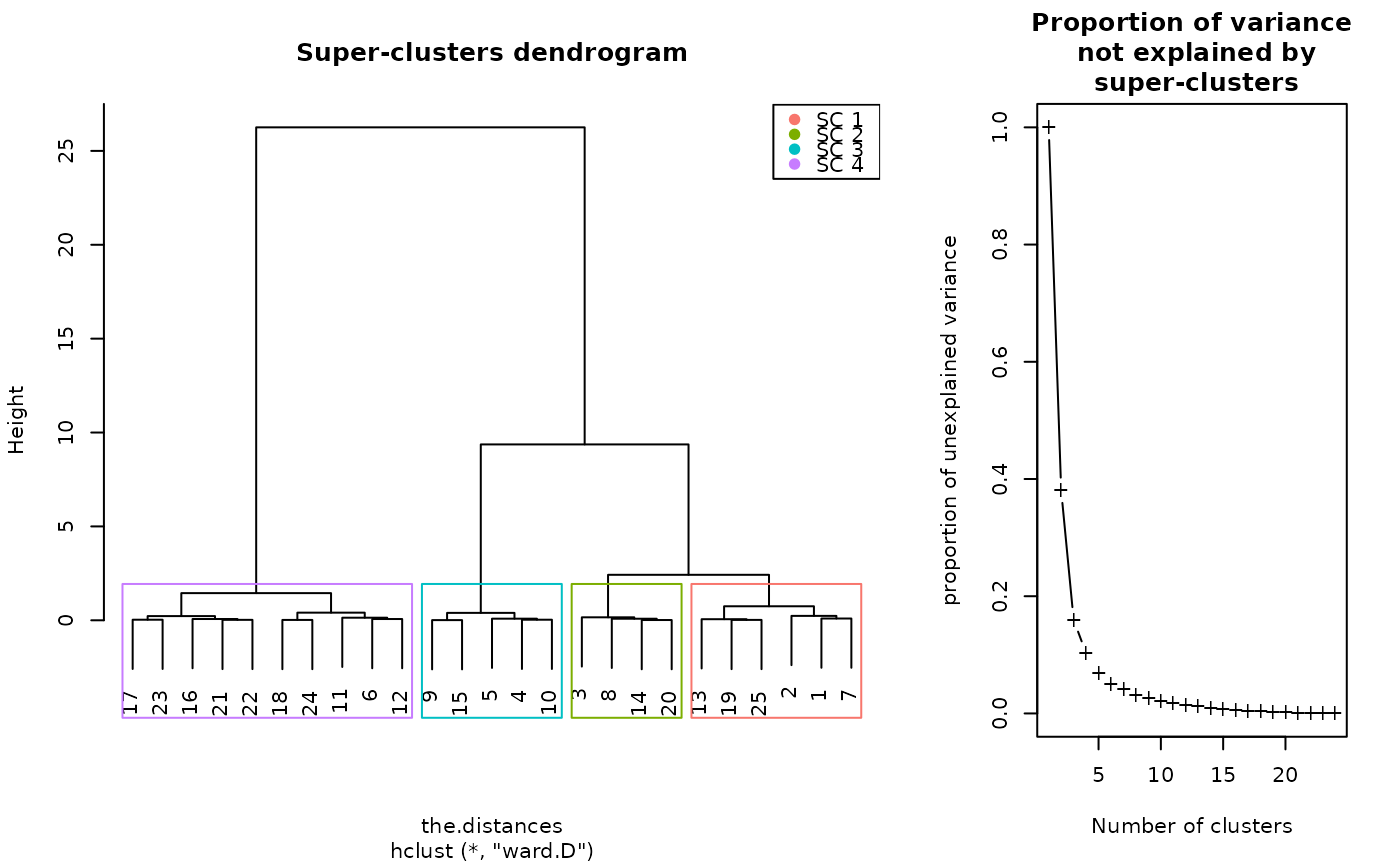
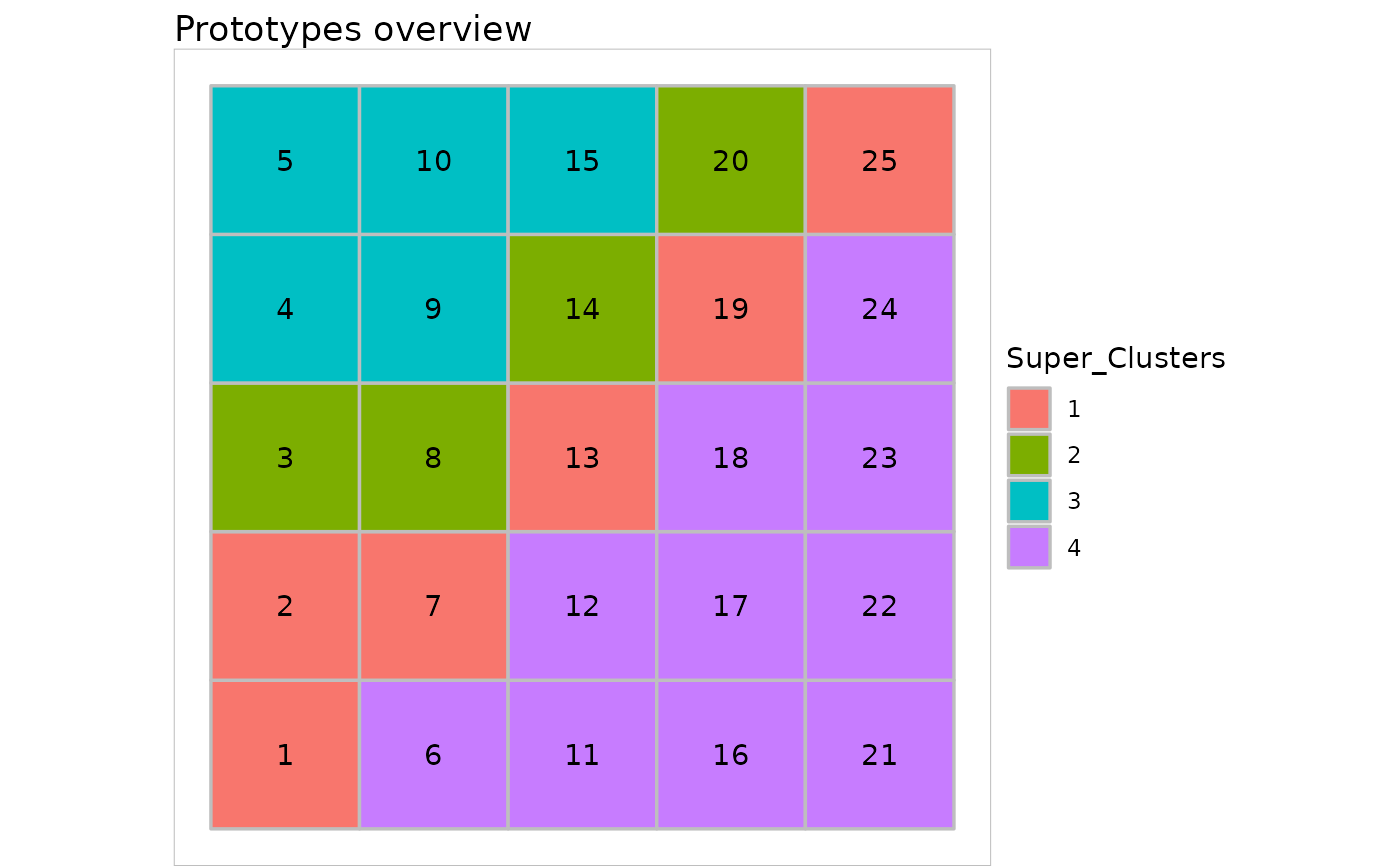
"dendrogram", to plot the dendrogram of the clustering. Case"grid"plots the grid with colors corresponding to the clusters of the super clustering. Case"projgraph"uses an is_igraph object passed to the argumentvariableand plots the projected graph as defined by the methodprojectIGraph. All other cases are those available in the functionplot.somResand superimpose the super-clusters over these plots.- plot.var
A boolean indicating whether a plot showing the evolution of the explained variance should be plotted. This argument is only used when
type = "dendrogram", its default value isTRUE.- show.names
Whether the cluster titles must be printed in center of the grid or not for
type = "grid". Default toFALSE(titles not displayed).- names
If
show.names = TRUE, values of the title to display fortype="grid". Default to "Cluster " followed by the cluster number.- init.graph
An igraph object which is projected according to the super-clusters. The vertices of
init.graphmust correspond to the rows of the original dataset processed by SOM (note that case"korresp"is not handled by this function). In the projected graph, the vertices are positioned at the center of gravity of the super-clusters (more details in the section Details below).
Value
The superClass method returns an object of class somSC,
which is a list of the following elements:
- cluster
The super clustering of the prototypes (only if either
korhare given by user).- tree
An
hclustobject.- som
The
somResobject given as argument (seetrainSOMfor details).
The projectIGraph method returns an object of class
is_igraph with the following attributes:
layoutprovides the layout of the projected graph according to the center of gravity of the super-clusters positioned on the SOM grid (graph attribute);
nameandsizerespectively are the vertex number on the grid and the number of vertexes included in the corresponding cluster (vertex attribute);
weightgives the number of edges (or the sum of the weights) between the vertexes of the two corresponding clusters (edge attribute).
Details
The superClass method can be used in 2 ways:
to choose the number of super clusters via an
hclustobject: then, both argumentskandhcan beNULL. In this case,superClassonly returns the dendrogram of the hierarchical clustering, which can then be cut with the methodcutree(to which eitherkorhmust be specified);to cut the clustering into super clusters. Then, either argument
kor argumenthmust be specified (seecutreefor details).
The squared distance between prototypes is passed to the algorithm.
summary on a superClass object produces a complete summary of
the results that displays the number of clusters and super-clusters, the
clustering itself and performs ANOVA analyses. For type = "numeric"
the ANOVA is performed for each input variable and test the difference of
this variable across the super-clusters of the map. For
type = "relational" a dissimilarity ANOVA is performed (see
(Anderson, 2001), except that in the present version, a crude estimate of the
p-value is used which is based on the Fisher distribution and not on a
permutation test.
On plots, the different super classes are identified in the following ways:
either with different color, when
typeis set among:"grid"(N, K, R),"hitmap"(N, K, R),"lines"(N, K, R),"barplot"(N, K, R),"boxplot","poly.dist"(N, K, R),"mds"(N, K, R),"dendro3d"(N, K, R),"graph"(R),"projgraph"(R);or with title, when
typeis set among:"color"(N, K),"pie"(N, R).
In the list above, the charts available for a numerical SOM are
indicated with a N, with a K for a korresp SOM and with an R for
relational SOM.
projectIGraph produces a projected graph from the
is_igraph object passed to the argument variable as
described in (Olteanu and Villa-Vialaneix, 2015). The attributes of this
graph are the same than the ones obtained from the SOM map itself in the
function projectIGraph. plot.somSC used with
type = "projgraph" calculates this graph and represents it by
positioning the super-vertexes at the center of gravity of the
super-clusters. This feature can be combined with pie.graph = TRUE to
super-impose the information from an external factor related to the
individuals in the original dataset (or, equivalently, to the vertexes of the
graph).
References
Anderson M.J. (2001). A new method for non-parametric multivariate analysis of variance. Austral Ecology, 26, 32-46.
Olteanu M., Villa-Vialaneix N. (2015) Using SOMbrero for clustering and visualizing graphs. Journal de la Societe Francaise de Statistique, 156, 95-119.
See also
Examples
set.seed(11051729)
my.som <- trainSOM(x.data = iris[, 1:4])
# choose the number of super-clusters
sc <- superClass(my.som)
plot(sc)
#> Warning: Impossible to plot the rectangles: no super clusters.
# cut the clustering
sc <- superClass(my.som, k = 4)
summary(sc)
#>
#>    SOM Super Classes
#>      Initial number of clusters:  25
#>      Number of super clusters  :  4
#>
#>
#>   Frequency table
#>  1  2  3  4
#>  6  4  5 10
#>
#>   Clustering
#>  1  2  3  4  5  6  7  8  9 10 11 12 13 14 15 16 17 18 19 20 21 22 23 24 25
#>  1  1  2  3  3  4  1  2  3  3  4  4  1  2  3  4  4  4  1  2  4  4  4  4  1
#>
#>
#>   ANOVA
#>
#>         Degrees of freedom :  3
#>
#>                    F pvalue significativity
#> Sepal.Length  98.631      0             ***
#> Sepal.Width   53.697      0             ***
#> Petal.Length 498.266      0             ***
#> Petal.Width  292.188      0             ***
#>
plot(sc)

plot(sc, type = "grid")

plot(sc, what = "obs", type = "hitmap")


# cut the clustering with a different number of clusters
sc <- superClass(my.som, k = 5)
summary(sc)
#>
#>    SOM Super Classes
#>      Initial number of clusters:  25
#>      Number of super clusters  :  5
#>
#>
#>   Frequency table
#> 1 2 3 4 5
#> 6 4 5 5 5
#>
#>   Clustering
#>  1  2  3  4  5  6  7  8  9 10 11 12 13 14 15 16 17 18 19 20 21 22 23 24 25
#>  1  1  2  3  3  4  1  2  3  3  4  4  1  2  3  5  5  4  1  2  5  5  5  4  1
#>
#>
#>   ANOVA
#>
#>         Degrees of freedom :  4
#>
#>                    F pvalue significativity
#> Sepal.Length  98.665      0             ***
#> Sepal.Width   43.472      0             ***
#> Petal.Length 535.416      0             ***
#> Petal.Width  320.388      0             ***
#>

# provide a precomputed clustering
sc2 <- superClass(my.som, clustering = sample(1:3, 25, replace = TRUE))
#> Warning: You are providing a precomputed clustering. The function will return a 'somSC' object with no associated dendrogram. Not all methods and plots will apply to this object.
# cut the clustering with a different number of clusters
sc <- superClass(my.som, k = 5)
summary(sc)
#>
#> SOM Super Classes
#> Initial number of clusters: 25
#> Number of super clusters : 5
#>
#>
#> Frequency table
#> 1 2 3 4 5
#> 6 4 5 5 5
#>
#> Clustering
#> 1 2 3 4 5 6 7 8 9 10 11 12 13 14 15 16 17 18 19 20 21 22 23 24 25
#> 1 1 2 3 3 4 1 2 3 3 4 4 1 2 3 5 5 4 1 2 5 5 5 4 1
#>
#>
#> ANOVA
#>
#> Degrees of freedom : 4
#>
#> F pvalue significativity
#> Sepal.Length 98.665 0 ***
#> Sepal.Width 43.472 0 ***
#> Petal.Length 535.416 0 ***
#> Petal.Width 320.388 0 ***
#>
# provide a precomputed clustering
sc2 <- superClass(my.som, clustering = sample(1:3, 25, replace = TRUE))
#> Warning: You are providing a precomputed clustering. The function will return a 'somSC' object with no associated dendrogram. Not all methods and plots will apply to this object.