Produce graphics to help interpreting a somRes object.
# S3 method for class 'somRes'
plot(
  x,
  what = c("obs", "prototypes", "energy", "add"),
  type = switch(what, obs = "hitmap", prototypes = "color", add = "pie", energy =
    "energy"),
  variable = NULL,
  my.palette = NULL,
  is.scaled = if (x$parameters$type == "numeric") TRUE else FALSE,
  show.names = TRUE,
  names = if (what != "energy") switch(type, graph = 1:prod(x$parameters$the.grid$dim),
    1:prod(x$parameters$the.grid$dim)) else NULL,
  proportional = TRUE,
  pie.graph = FALSE,
  pie.variable = NULL,
  s.radius = 1,
  view = if (x$parameters$type == "korresp") "r" else NULL,
  ...
)
Arguments
- x
A
somResclass object.- what
What you want to plot. Either the observations (
obs, default case), the evolution of energy (energy), the prototypes (prototypes) or an additional variable (add).- type
Further argument indicating which type of chart you want to have. Choices depend on the value of
what(what="energy"has notypeargument). Default values are"hitmap"forobs,"color"forprototypesand"pie"foradd. See section “Details” below for further details.- variable
Either the variable to be used for
what="add"or the index of the variable of the data set to consider. Fortype="boxplot", the default value is the sequence from 1 to the minimum between 5 and the number of columns of the data set. In all other cases, default value is 1. SeesomRes.plottingfor further details.- my.palette
A vector of colors. If omitted, predefined palettes are used, depending on the plot case. This argument is used for the following combinations: all
"color"types and"prototypes"/"poly.dist".- is.scaled
A boolean indicating whether values should be scaled prior to plotting or not. Default value is
TRUEwhentype="numeric"andFALSEin the other cases.- show.names
Boolean used to indicate whether each neuron should have a title or not, if relevant. Default to
TRUE. It is feasible on the following cases: all"color","lines","meanline","barplot","boxplot","names"types,"add"/"pie","prototypes"/"umatrix","prototypes"/"poly.dist"and"add"/"words".- names
The names to be printed for each neuron if
show.names=TRUE. Default to a number which identifies the neuron.- proportional
Boolean used when
what="add"andtype="pie". It indicates if the pies should be proportional to the number of observations in the class. Default value isTRUE.- pie.graph
Boolean used when
what="add"andtype="graph". It indicates if the vertices should be pies or not.- pie.variable
The variable needed to plot the pies when
what="add",type="graph"and argumentpie.graph=TRUE.- s.radius
The size of the pies to be plotted (maximum size when
proportional=TRUE) forwhat="add",type="graph"andpie.graph=TRUE. The default value is0.9.- view
Used only when the algorithm's type is
"korresp". It indicates whether rows ("r") or columns ("c") must be drawn.- ...
Further arguments to be passed to the underlined plot function (which can be
plot,barplot,pie... depending ontype; seesomRes.plottingfor further details).
Details
See somRes.plotting for further details and more
examples.
See also
trainSOM to run the SOM algorithm, that returns a
somRes class object.
Examples
# run the SOM algorithm on the numerical data of 'iris' data set
iris.som <- trainSOM(x.data = iris[, 1:4], nb.save = 2)
# plots
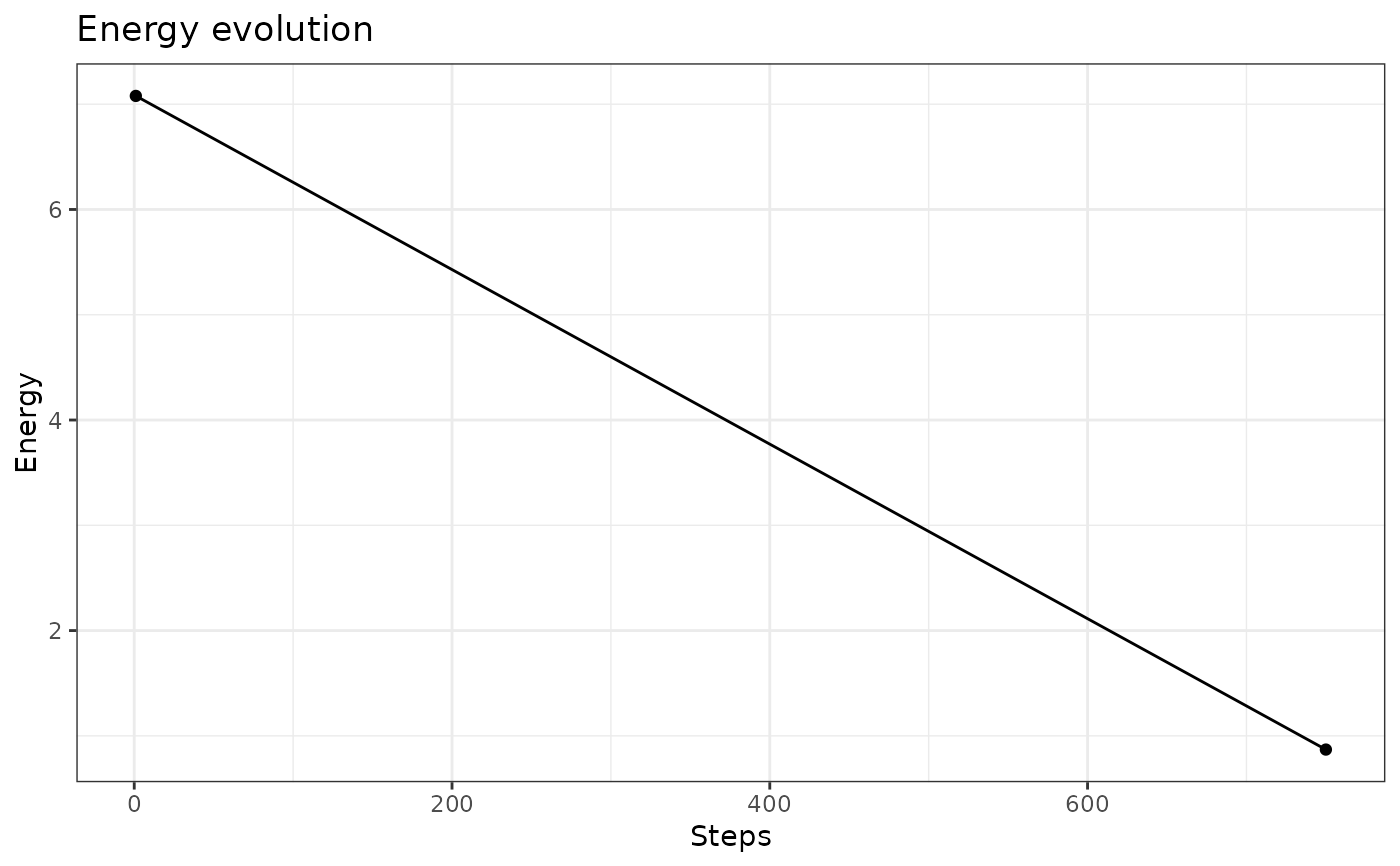
# on energy
plot(iris.som, what = "energy")
 # on observations
plot(iris.som, what = "obs", type = "lines")
# on observations
plot(iris.som, what = "obs", type = "lines")
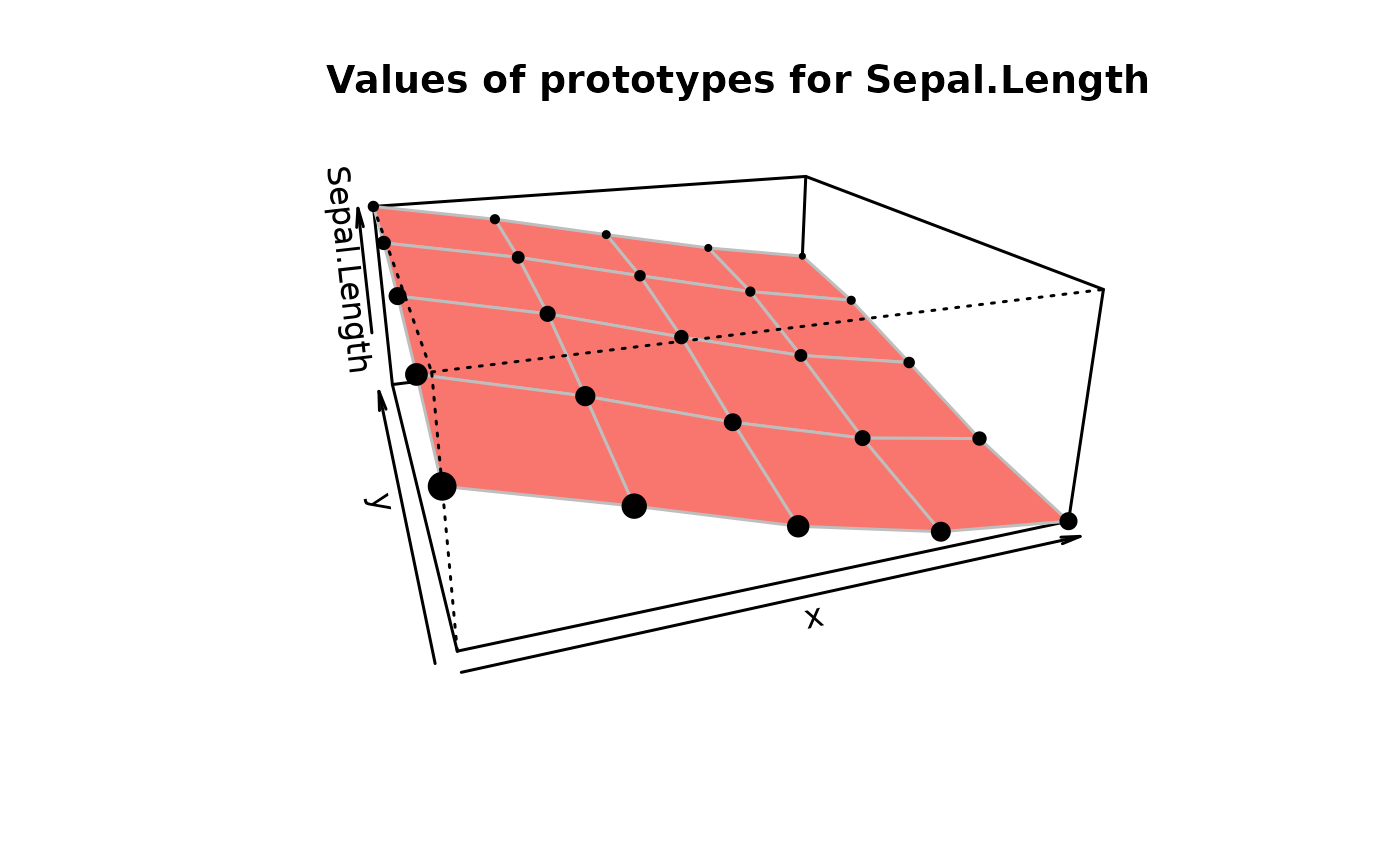
 # on prototypes
plot(iris.som, what = "prototypes", type = "3d", variable = "Sepal.Length")
# on prototypes
plot(iris.som, what = "prototypes", type = "3d", variable = "Sepal.Length")
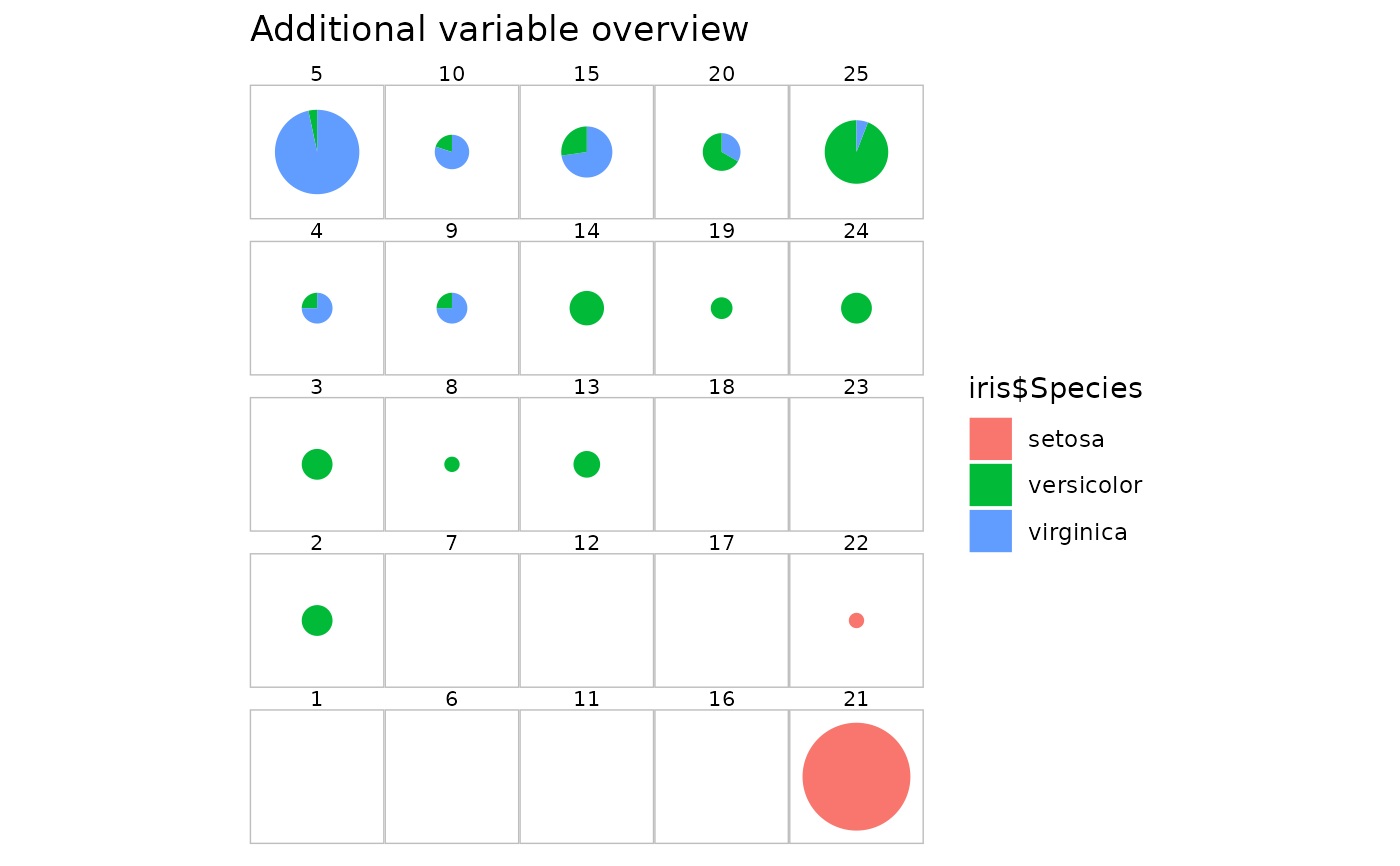
 # on an additional variable: the flower species
plot(iris.som, what = "add", type = "pie", variable = iris$Species)
# on an additional variable: the flower species
plot(iris.som, what = "add", type = "pie", variable = iris$Species)