A basic vignette on grids in SOMbrero
07 octobre, 2025
Source:vignettes/b-doc-grids.Rmd
b-doc-grids.RmdDefinition and purpose of a myGrid class object
Objects of class myGrid are made to display the SOM
grid.
Basic functions on a myGrid class object
In this section, we will consider only the four basic functions that
can be applied on a myGrid class object:
initGrid,print.myGridsummary.myGridplot.myGrid
The initGrid function
The initGrid function initializes a new
myGrid object. It has 3 arguments:
dimension, which is a vector of two integers. The first one is the x dimension (number of neurons/units on the x axis) and the second one is the y dimension. The default dimensions are x=5 and y=5,topo, which is the chosen topology. The value of this argument must be one ofsquareorhexagonal. The__default value__ is square.dist.type, which is the distance type to compute the distance between two neurons of the grid. The default value is euclidean and the coordinates of the neurons on the grid are chosen so as the minimum Euclidean distance between two neurons is exactly 1.hexagonaltopoology is only compatible with the Euclidean distance.
The following R code initializes a new
myGrid object of square topology, x dimension 5 and y
dimension 6, and distance type maximum.
The print.myGrid function
The myGrid object print function prints the
main features of the chosen object in the console. The only argument is
the object to be printed.
Considering the previously initialized grid, the print command is:
print(first_grid)##
## Self-Organizing Map structure
##
## Features :
## topology : square
## x dimension : 5
## y dimension : 6
## distance type: maximumThe summary.myGrid function
The myGrid object summary function is quite
simple. It only prints the class of the object and then calls the print
function previously described. The only argument is the object to be
summarized.
summary(first_grid)##
## Summary
##
## Class : myGrid
##
##       Self-Organizing Map structure
##
##         Features   :
##            topology     :  square
##            x dimension  :  5
##            y dimension  :  6
##            distance type:  maximum
The plot.myGrid function
The myGrid object plot function draws the
squared area corresponding to the object, in a new graphical window. It
has 3 parameters:
the object to be plotted,
show.names, boolean, indicating if the names of the neurons should be displayed on the graph (default toTRUE)names, a vector, giving the names of the neurons ifshow.names = TRUE, default to the number of the neuron.
plot(first_grid)## Warning: Using `size` aesthetic for lines was deprecated in ggplot2 3.4.0.
## ℹ Please use `linewidth` instead.
## ℹ The deprecated feature was likely used in the SOMbrero package.
## Please report the issue at <https://github.com/tuxette/SOMbrero/issues>.
## This warning is displayed once every 8 hours.
## Call `lifecycle::last_lifecycle_warnings()` to see where this warning was
## generated.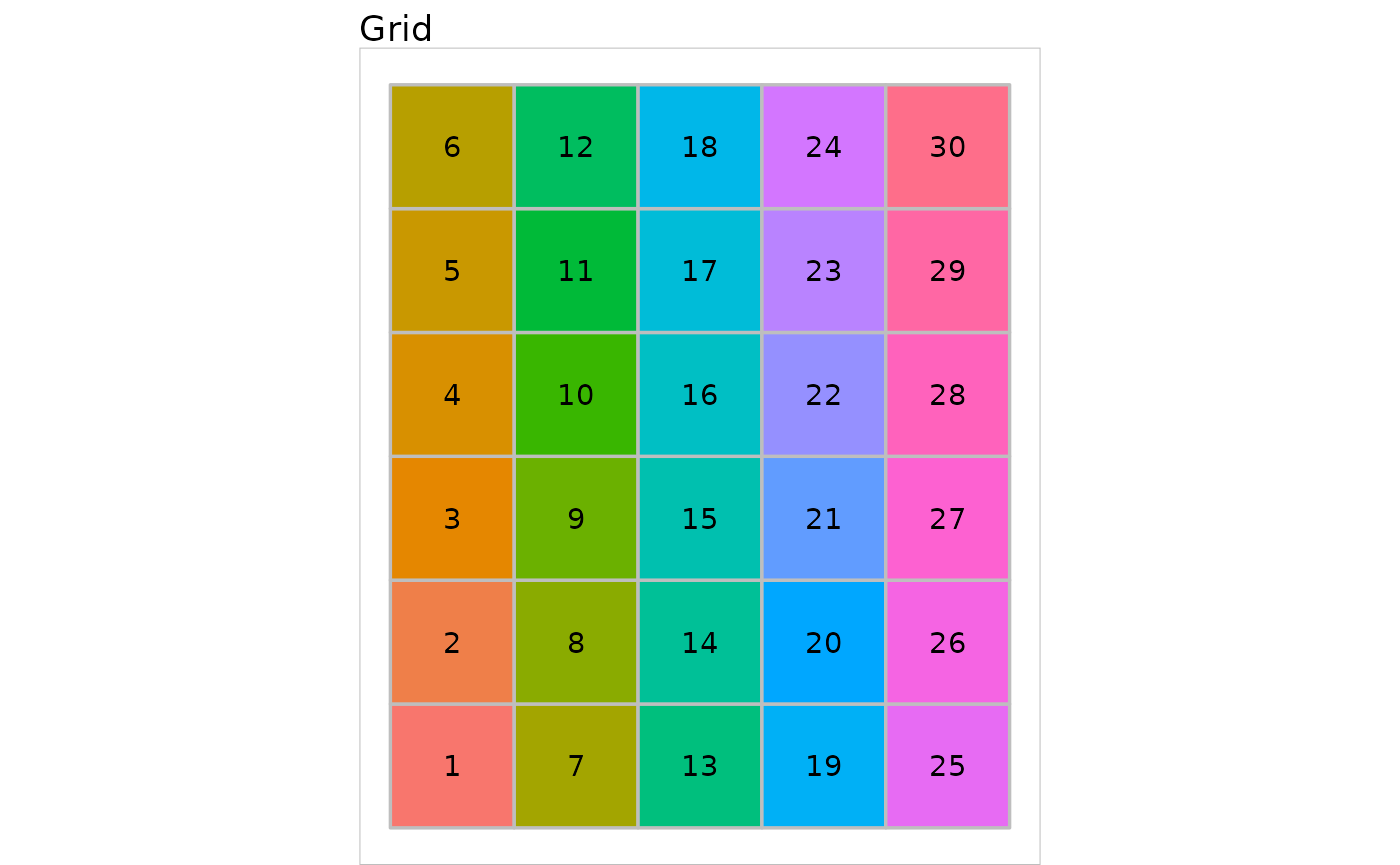
plot(first_grid) + ggplot2::scale_fill_manual(values = rep("white", 30))
my_palette <- colorRampPalette(c("white", "pink", "purple"))(30)
plot(first_grid, show.names = FALSE) +
  ggplot2::scale_fill_manual(values = my_palette)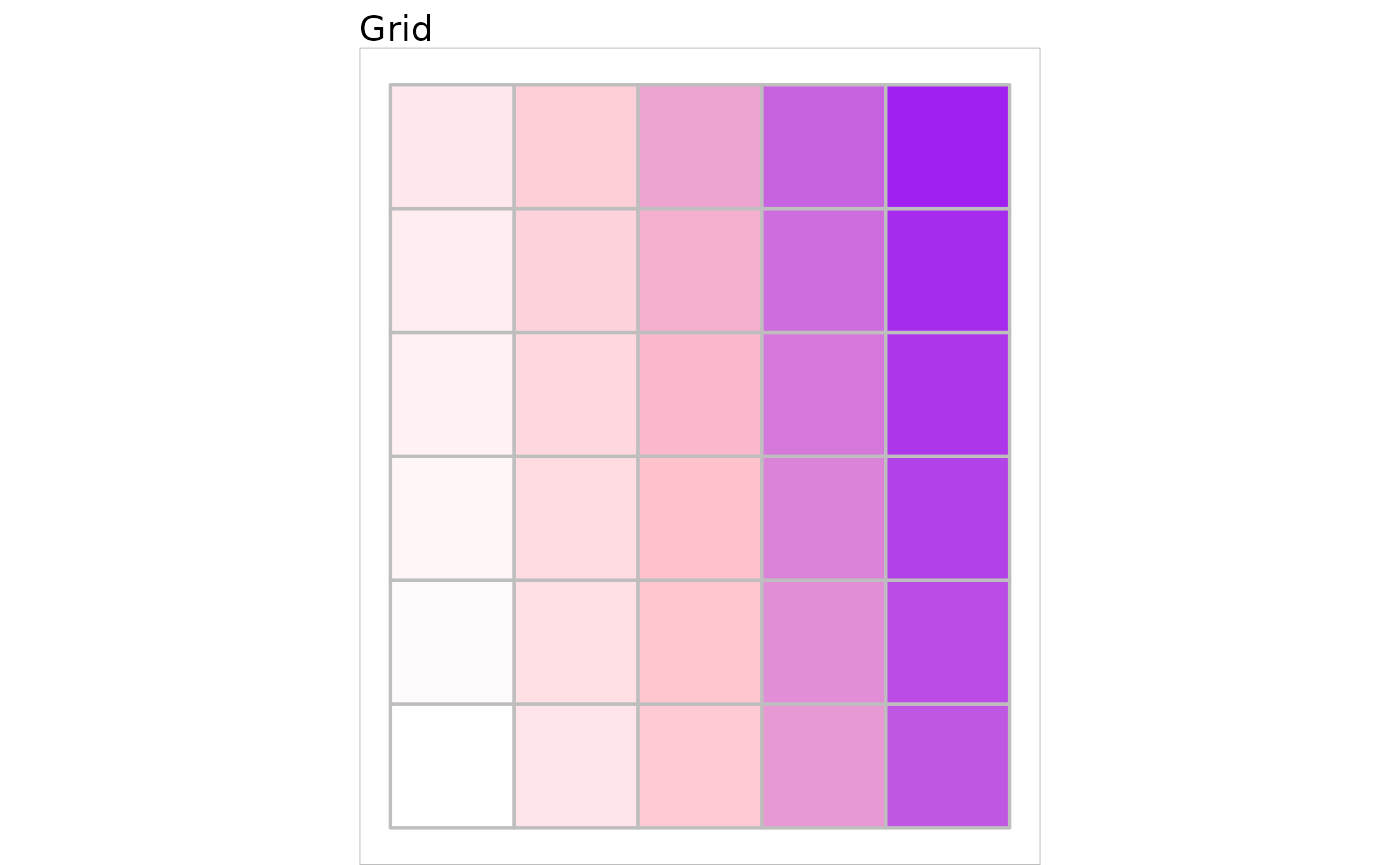
Hexagonal grids can be displayed similarly:
second_grid <- initGrid(dimension = c(4, 5), topo = "hexagonal")
plot(second_grid, names = paste0("N", 1:20)) +
  ggplot2::ggtitle("Hexagonal SOM grid")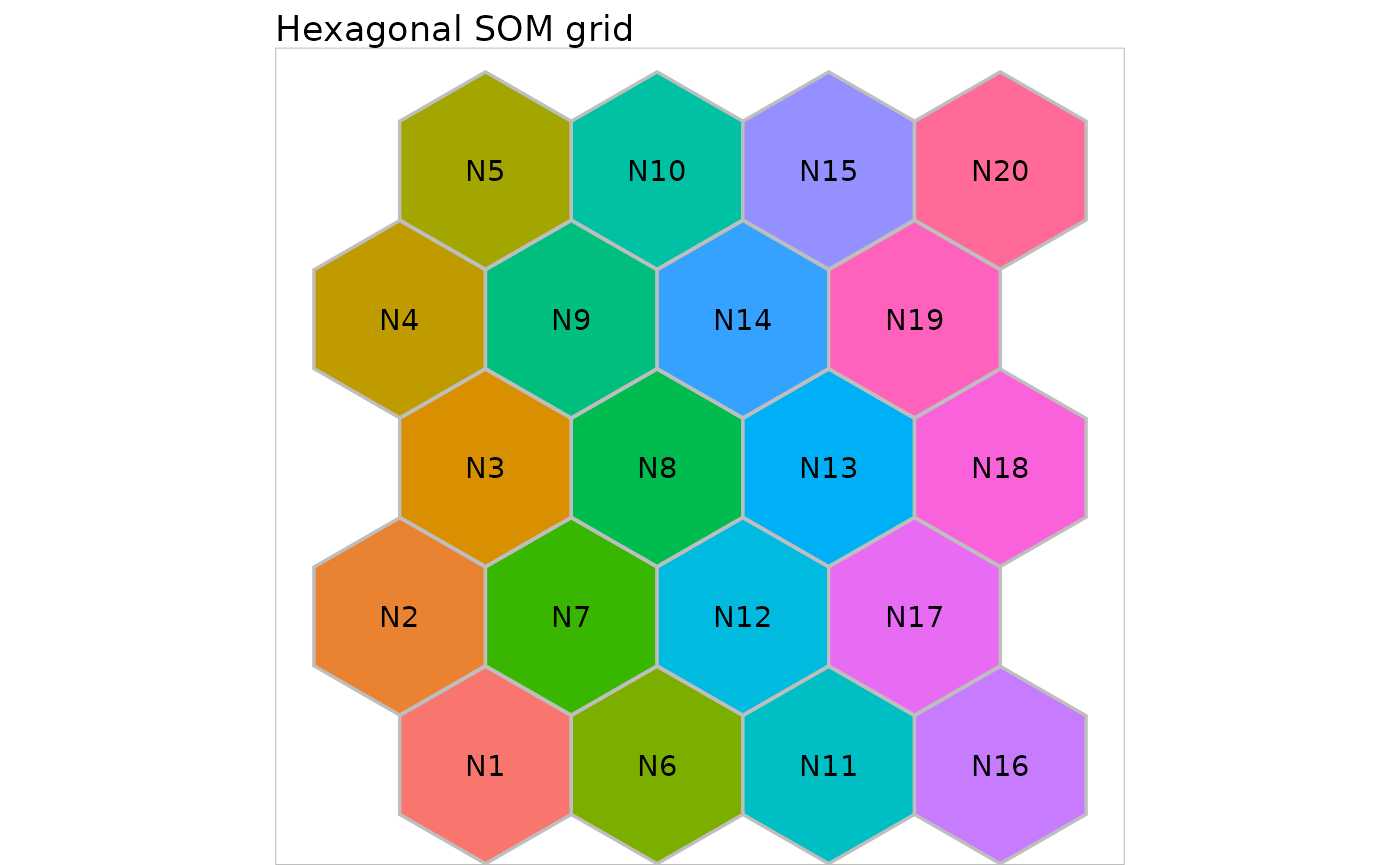
Session information
This vignette has been compiled with the following environment:
## R version 4.5.1 (2025-06-13)
## Platform: x86_64-pc-linux-gnu
## Running under: Ubuntu 24.04.3 LTS
##
## Matrix products: default
## BLAS:   /usr/lib/x86_64-linux-gnu/openblas-pthread/libblas.so.3
## LAPACK: /usr/lib/x86_64-linux-gnu/openblas-pthread/libopenblasp-r0.3.26.so;  LAPACK version 3.12.0
##
## locale:
##  [1] LC_CTYPE=en_US.UTF-8       LC_NUMERIC=C
##  [3] LC_TIME=fr_FR.UTF-8        LC_COLLATE=en_US.UTF-8
##  [5] LC_MONETARY=fr_FR.UTF-8    LC_MESSAGES=en_US.UTF-8
##  [7] LC_PAPER=fr_FR.UTF-8       LC_NAME=C
##  [9] LC_ADDRESS=C               LC_TELEPHONE=C
## [11] LC_MEASUREMENT=fr_FR.UTF-8 LC_IDENTIFICATION=C
##
## time zone: Europe/Paris
## tzcode source: system (glibc)
##
## attached base packages:
## [1] stats     graphics  grDevices utils     datasets  methods   base
##
## other attached packages:
## [1] SOMbrero_1.5.0 markdown_2.0   igraph_2.1.4
##
## loaded via a namespace (and not attached):
##  [1] sass_0.4.10          generics_0.1.4       xml2_1.4.0
##  [4] lattice_0.22-7       digest_0.6.37        magrittr_2.0.4
##  [7] evaluate_1.0.5       grid_4.5.1           RColorBrewer_1.1-3
## [10] fastmap_1.2.0        jsonlite_2.0.0       backports_1.5.0
## [13] ggwordcloud_0.6.2    scales_1.4.0         textshaping_1.0.3
## [16] jquerylib_0.1.4      cli_3.6.5            crayon_1.5.3
## [19] rlang_1.1.6          scatterplot3d_0.3-44 withr_3.0.2
## [22] cachem_1.1.0         yaml_2.3.10          tools_4.5.1
## [25] deldir_2.0-4         memoise_2.0.1        checkmate_2.3.3
## [28] dplyr_1.1.4          colorspace_2.1-2     interp_1.1-6
## [31] ggplot2_4.0.0        vctrs_0.6.5          R6_2.6.1
## [34] png_0.1-8            lifecycle_1.0.4      fs_1.6.6
## [37] htmlwidgets_1.6.4    ragg_1.5.0           pkgconfig_2.0.3
## [40] desc_1.4.3           hexbin_1.28.5        pkgdown_2.1.3
## [43] pillar_1.11.1        bslib_0.9.0          gtable_0.3.6
## [46] glue_1.8.0           data.table_1.17.8    Rcpp_1.1.0
## [49] systemfonts_1.3.1    xfun_0.53            tibble_3.3.0
## [52] tidyselect_1.2.1     knitr_1.50           farver_2.1.2
## [55] htmltools_0.5.8.1    labeling_0.4.3       rmarkdown_2.30
## [58] metR_0.18.2          compiler_4.5.1       S7_0.2.0
## [61] gridtext_0.1.5