Methods for the result of initGrid
(myGrid object)
Arguments
- x
myGridobject- ...
Further arguments to the
plotfunction.- object
myGridobject- show.names
Whether the cluster names must be printed in center of the grid or not. Default to
TRUE(names not displayed).- names
If
show.names = TRUE, values of the names to display. Default to the cluster number.
Details
The myGrid class has the following entries:
coord2-column matrix with x and y coordinates of the grid unitstopotopology of the grid;dimdimensions of the grid (width corresponds to x coordinates)dist.typedistance type that defines the topology of the grid.
During plotting, the color filling process uses the coordinates of the object
x included in x$coord.
See also
initGrid to define a myGrid class object.
Examples
# creating grid
a.grid <- initGrid(dimension=c(5,5), topo="square", dist.type="maximum")
# plotting grid
# without any color specification
plot(a.grid)
#> Warning: Using `size` aesthetic for lines was deprecated in ggplot2 3.4.0.
#> ℹ Please use `linewidth` instead.
#> ℹ The deprecated feature was likely used in the SOMbrero package.
#> Please report the issue at <https://github.com/tuxette/SOMbrero/issues>.
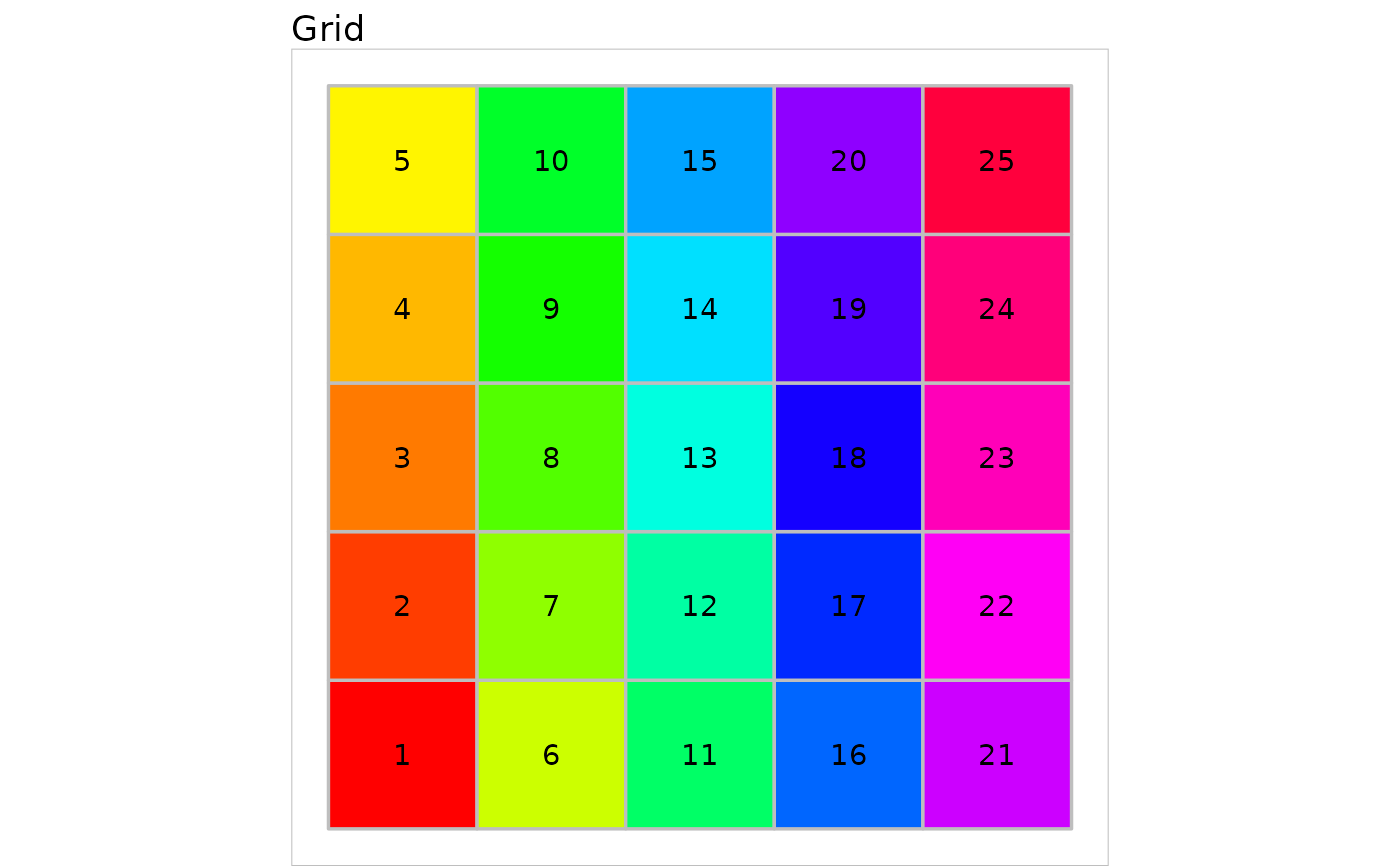
 # generating colors from rainbow() function
my.colors <- grDevices::rainbow(5*5)
plot(a.grid) + ggplot2::scale_fill_manual(values = my.colors)
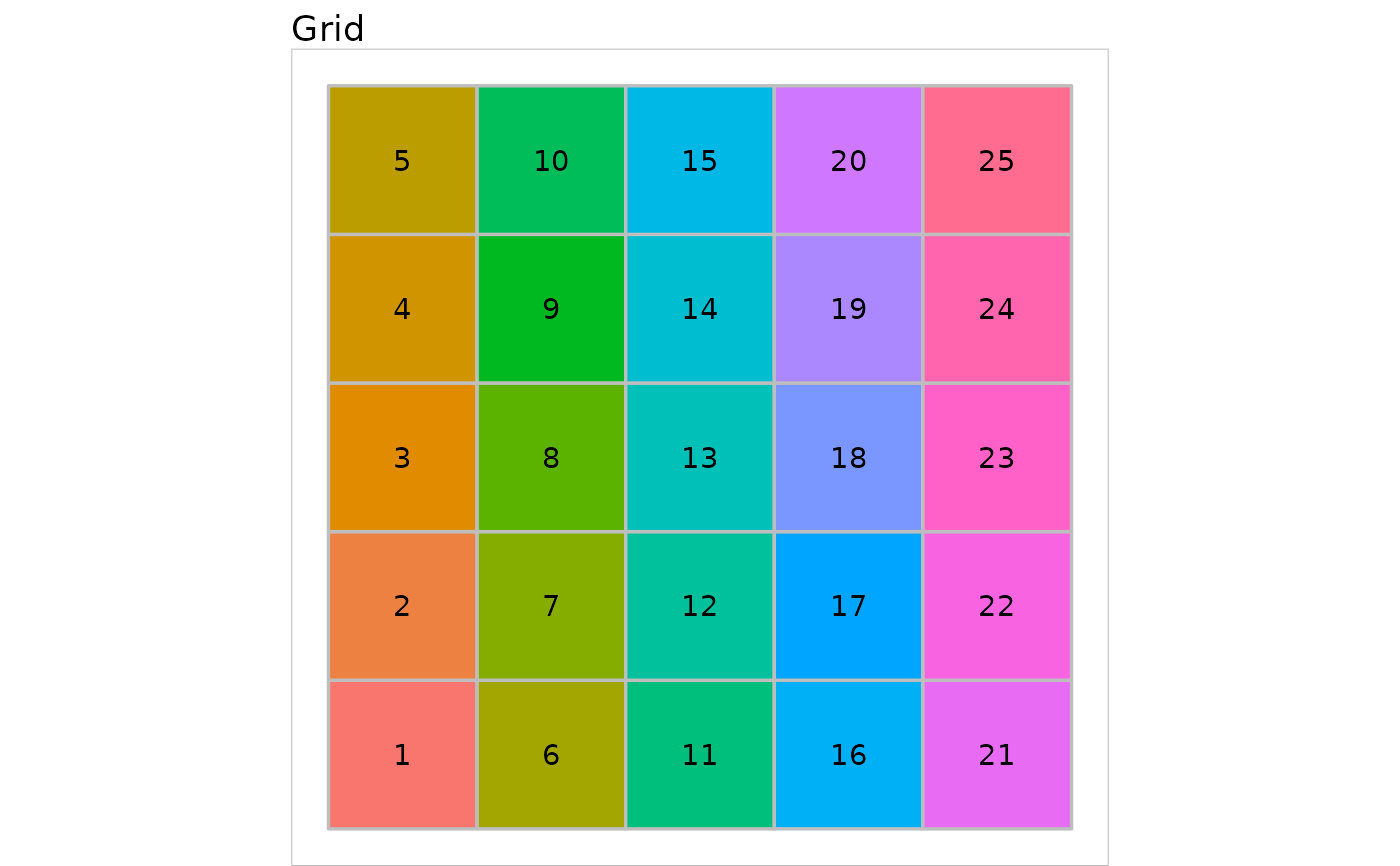
# generating colors from rainbow() function
my.colors <- grDevices::rainbow(5*5)
plot(a.grid) + ggplot2::scale_fill_manual(values = my.colors)